Non-intrusive continuous scanning for railway joint degradation
An attempt at detecting vibration patterns that are indicative of joint degradation
December 29th, 2022
Outline
This project is a 5-ECTS Individual Study Activity done at the The Maersk Mc-Kinney Møller Institute.
Public transport is popular in Denmark with DSB carrying out millions of journeys annually across hundreds of stations. However, frequent use causes degradation of the railway joints, which can lead to delays and frustration for passengers. Banedanmark must periodically inspect tracks to detect significant degradation, otherwise, repairs may have to be done urgently, causing disruption to train services. This project aims to create a device prototype that can be placed on a train to monitor vibrations as it passes over track joints. The constant scanning would provide essential data to detect changes in vibration response, allowing Banedanmark to be more proactive in decision-making and schedule less inconvenient inspections of track segments. The project will also determine the feasibility of the device and its potential outcome.
In Denmark, the IVB30 isolated rail joint is commonly used to connect two UIC60 tracks, which consists of a direction-specific joint with either four or six bolts. Banedanmark has provided a dataset of 40,000 joint positions in Denmark, which is vital for the project to detect specific types of joints. A device placed in contact with the train should give readings on joint health by actively monitoring vibrations created as the train passes over the joints. This approach is non-intrusive and doesn't require much effort to install. However, it has challenges as it relies on the device delivering high-quality images of the vibration pattern throughout a passenger’s journey. Normalization of data extracted from the prototype’s sensors will be achieved by using the position data from the GPS. A piece of analysis software will be built that allows for easy inspection by manipulating and plotting sensor data. The prototype will concentrate on the route between Aarhus and Skanderborg, which is roughly 22 km and takes about 15-20 minutes. The device will be portable, allowing it to be moved between trains easily.To fulfill the goals of this project, three tools have been made:
- The device responsible for collecting vibration data.
- An app that communicates with the device to initiate recordings and monitors vital information.
- Analysis software that can help make sense of the data
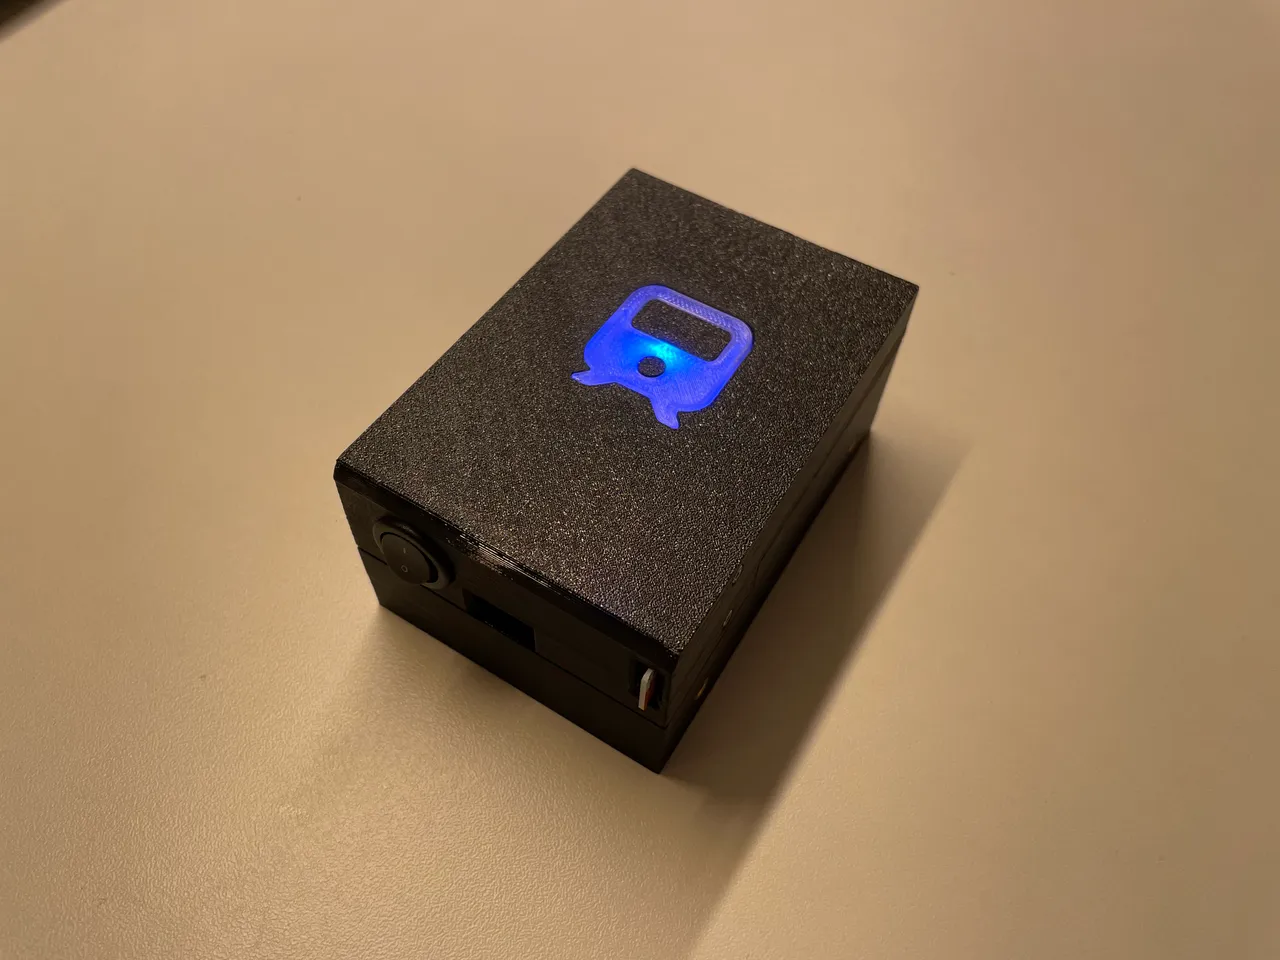
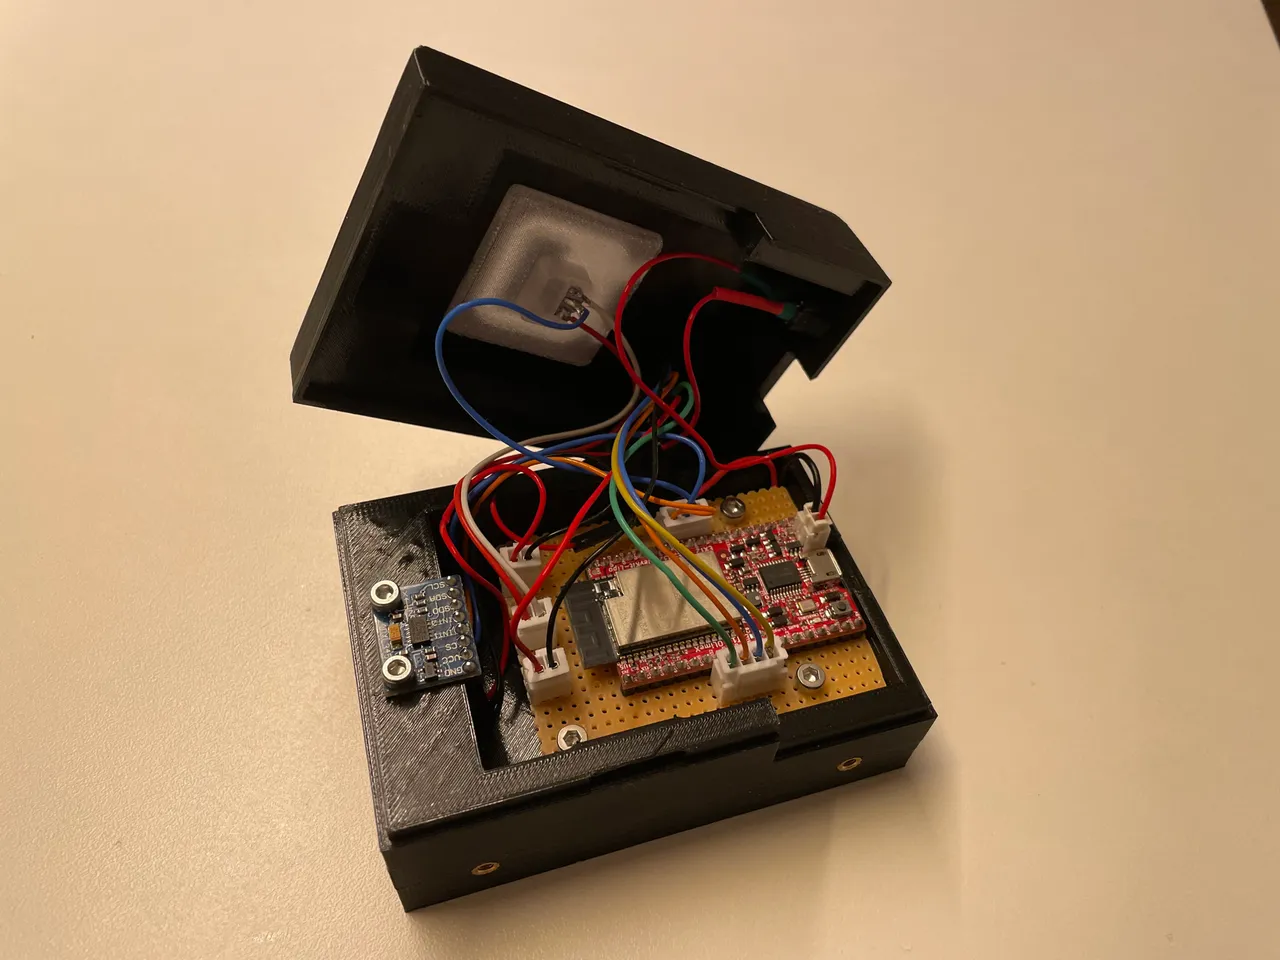
The device
The device is baed on an ESP32-Olimex and uses the ADXL345 accelerometer, in combination with an SDCard to store recordings.
The ESP-IDF framework using the C language is used for the development of the prototype. To enable Bluetooth Connectivity the MyNewt Nimble Apache library is used. The following bluetooth characteristics have been implemented:
- Current Time (Read)
- State (Read and Write)
- Calibration (Read and Write)
- Recording id (Read)
- Battery (Read)
- Samples (Read).
These characteristics allows the device to be easily queried and its parameters altered on the go.
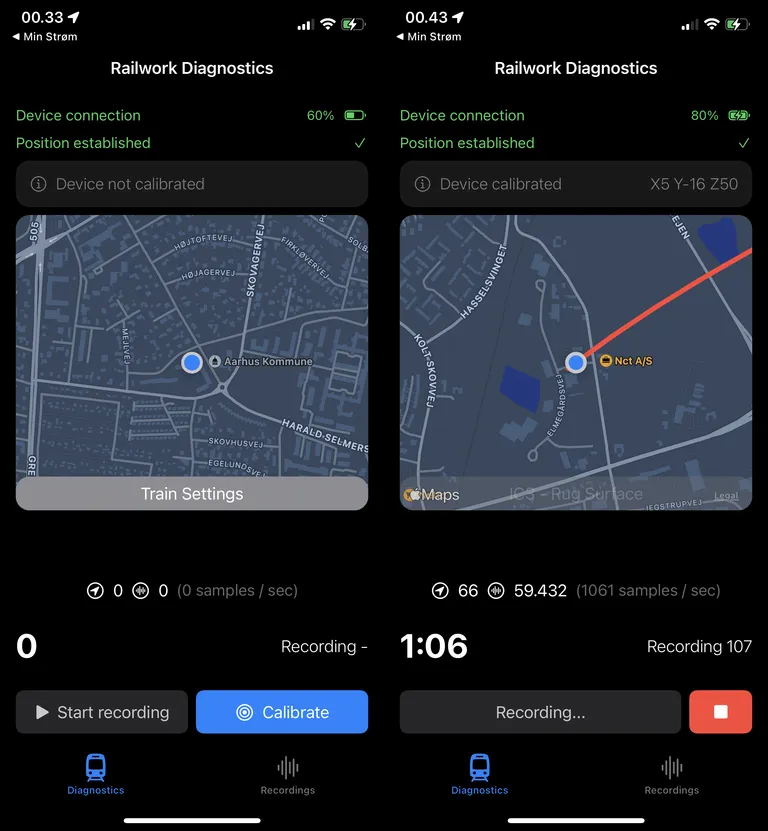
The app
For the development of the iOS app, Swift is used. The app connects automatically to the device through BLE upon start-up. When connected, the user can calibrate the device and start a recording. When a recording is started, the app synchronizes timing with the device to ensure the GPS positions collected have a reference point. A GUI is created to display relevant information and interact with the device. The continuous connectivity gives the app a real-time indication of what the device is currently doing. The app refreshes data from the device every second until recording has begun, at which point the updates are only fetched every 30 seconds to put less stress on the device.
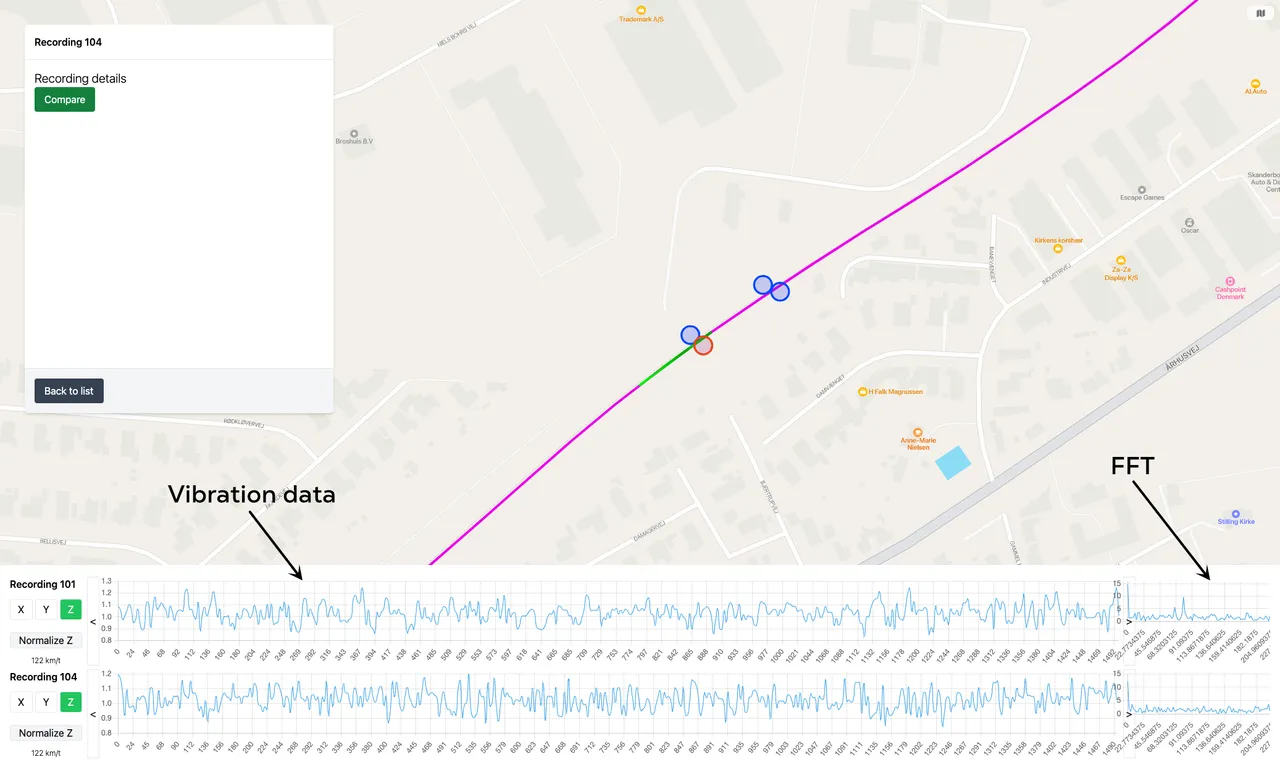
The analsysis and visualization
Data is stored in two separate databases. Spatial data points for joint locations provided by BaneDanmark are stored in a MySQL instance, while position data from the app and sensor data from the prototype device are stored in MongoDB, which scales well with larger datasets. MapKitJS is used to place joint positions onto a map, and recorded routes can be overlaid to see which joints were in direct contact with the train’s path. A gradient stroke color on the route path indicates which direction the train was heading, ensuring comparisons are made on the same route. Clicking a joint finds the nearest position recorded by the app, and this point includes a timestamp to query the vibration data sampled by the device. The interface overlays the relevant path segment onto the map and displays a chart of the vibration samples and Fast-Fourier Transformation (FFT) output on the same samples. The visualization tool allows another route to be compared against the current one by finding vibration samples close to the same joint and running the same algorithm, then adding the chart above the current one for easy analysis.
Findings (or the lack thereof)
The solution comprises a measuring prototype, an app that collects GPS positions, and an analytics platform to visualize the route and vibration data. Initial field testing revealed issues with the iOS API's positional events and the accelerometer's maximum obtainable speed, causing gaps in data when the train traveled faster. Six trips between Skanderborg Station and Aarhus Central Station were analyzed, but the data analysis gave inconclusive results, leaving the feasibility of the project undetermined. Nonetheless, it provides a foundation for further experimentation.
If you've found the project intriguing the entire report can be found here: Report
The code for the three parts are open-source and available on GitHub: